Visual Data
Fall 2020-2021
Project Brief:
Analyze a set of given information and convert it to visual data (a poster series) which will then be made into a mobile app prototype/dashboard
Analyze a set of given information and convert it to visual data (a poster series) which will then be made into a mobile app prototype/dashboard
Project Steps:
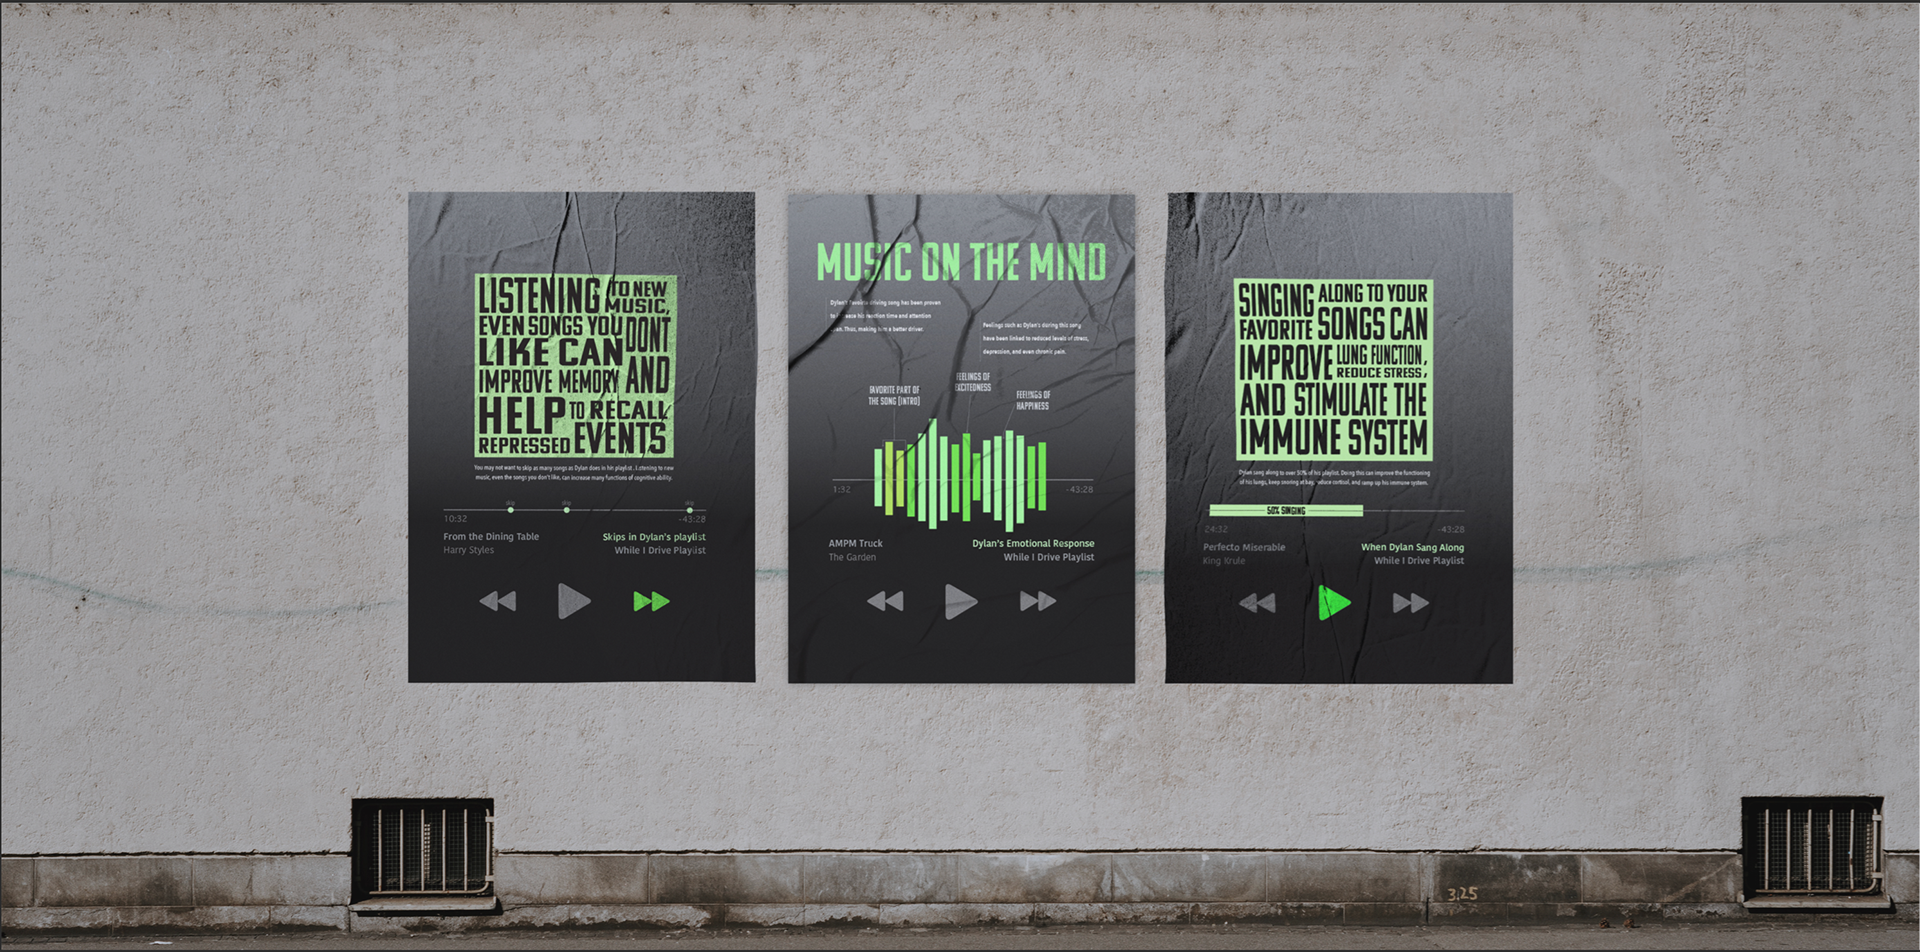
Begin by translating data into public information
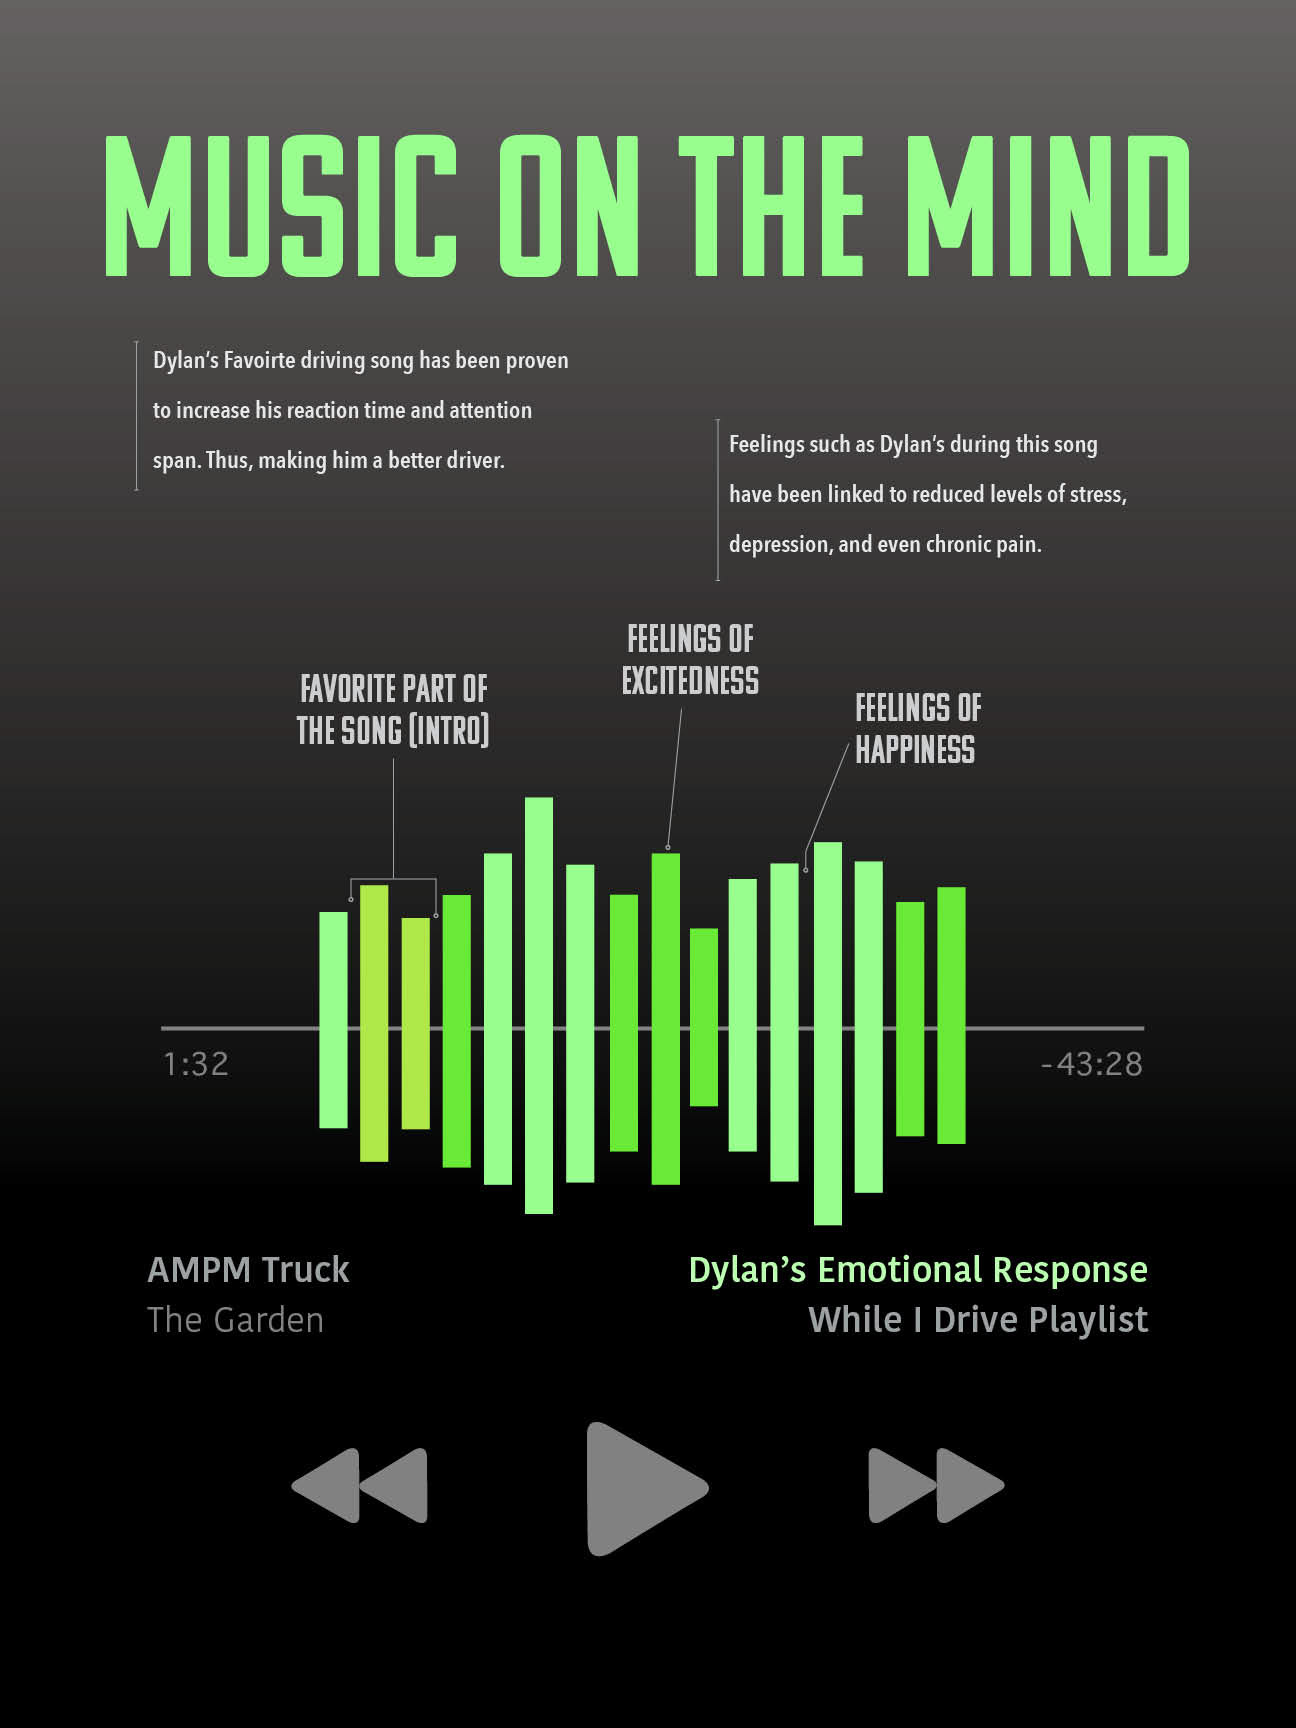
Use the data to create a Infographic
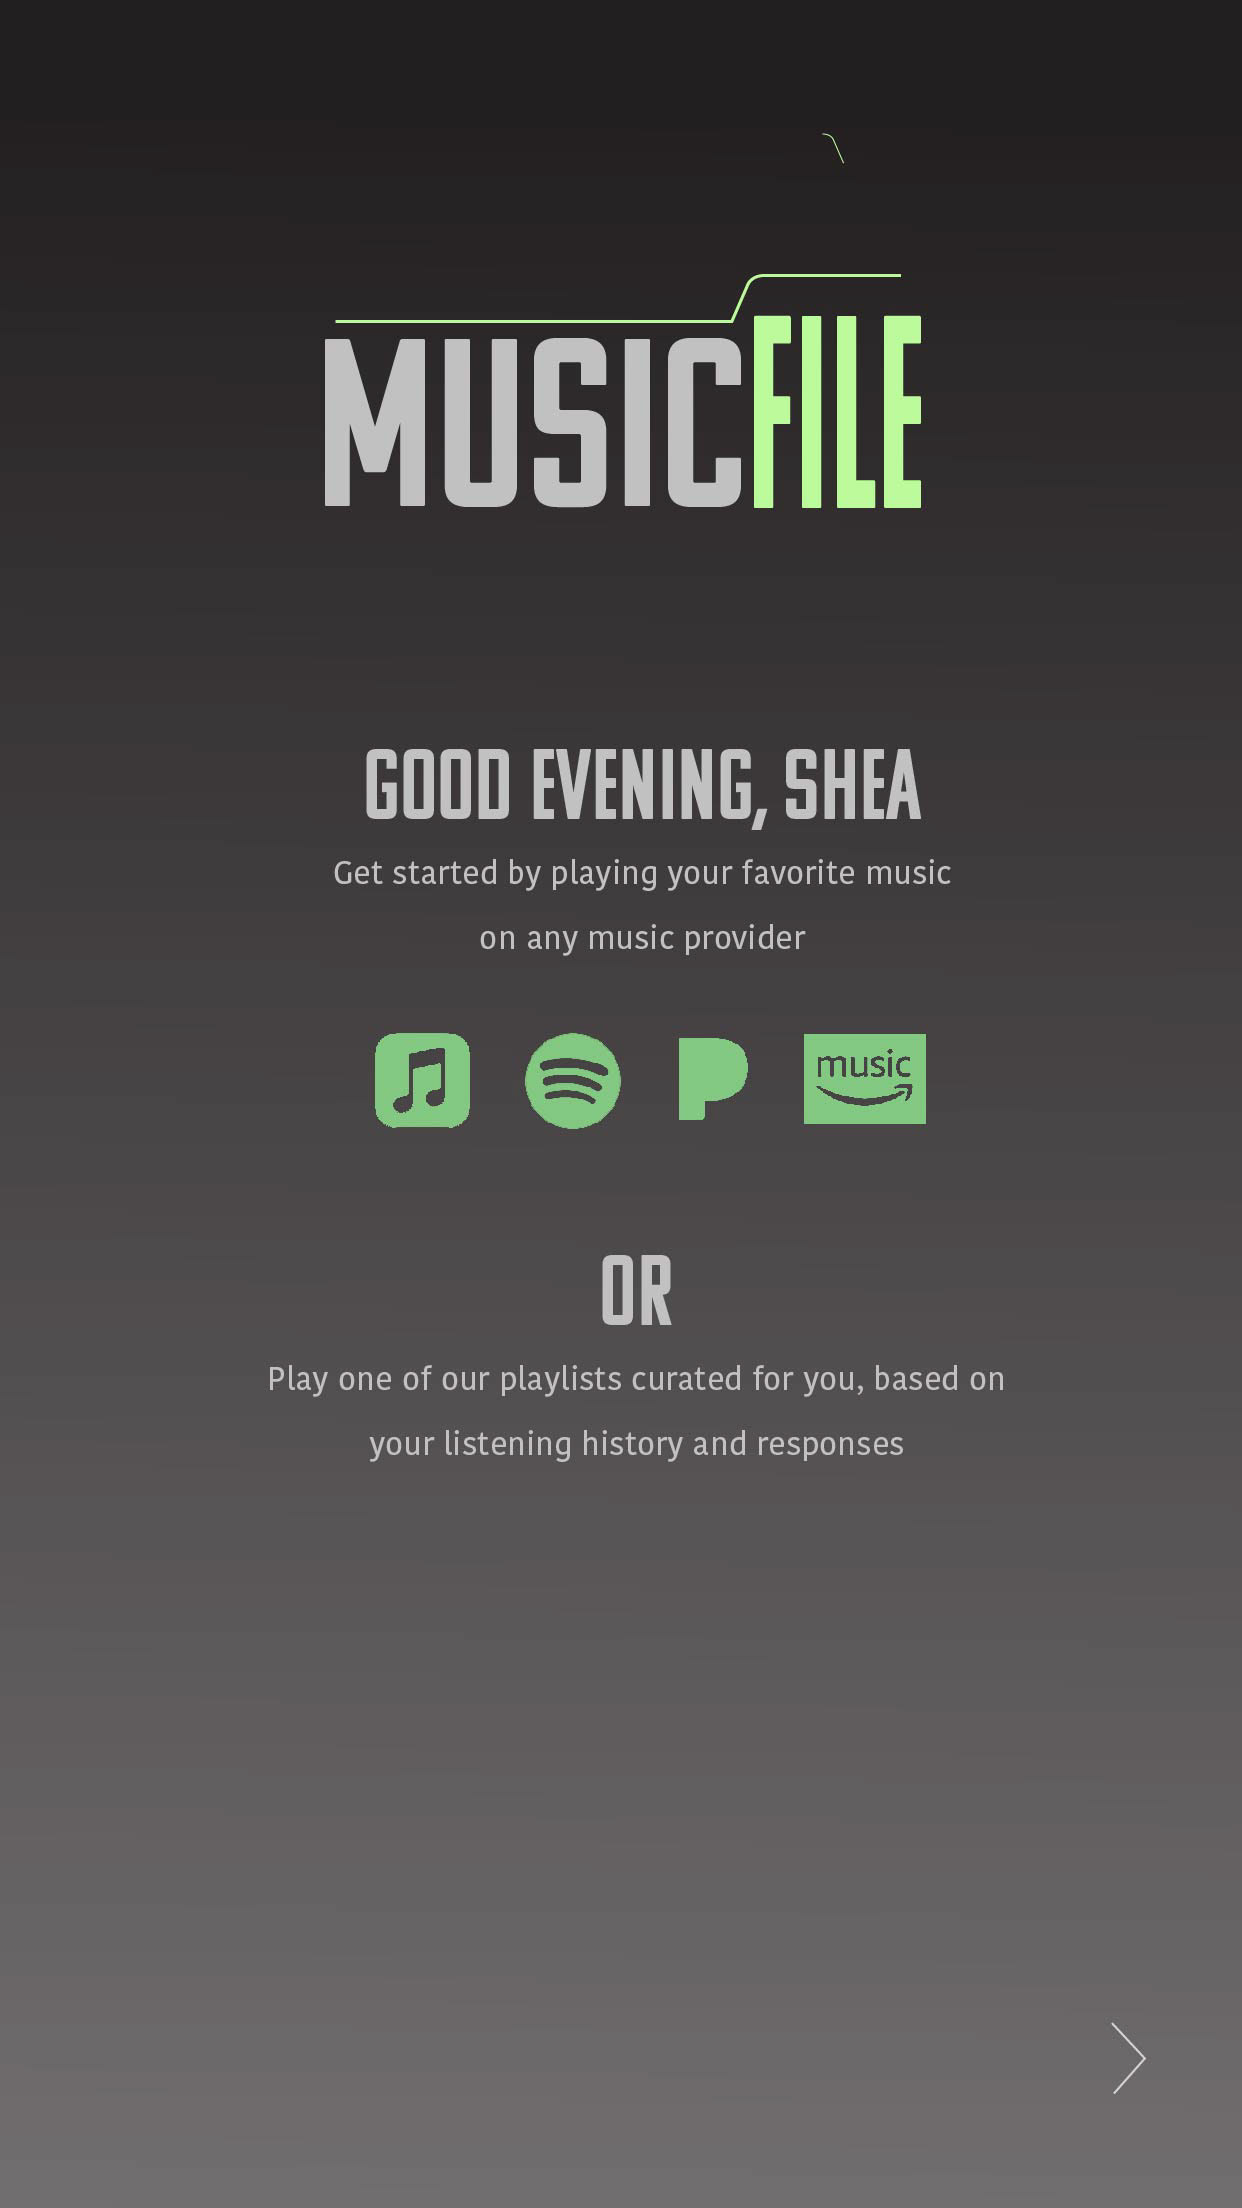
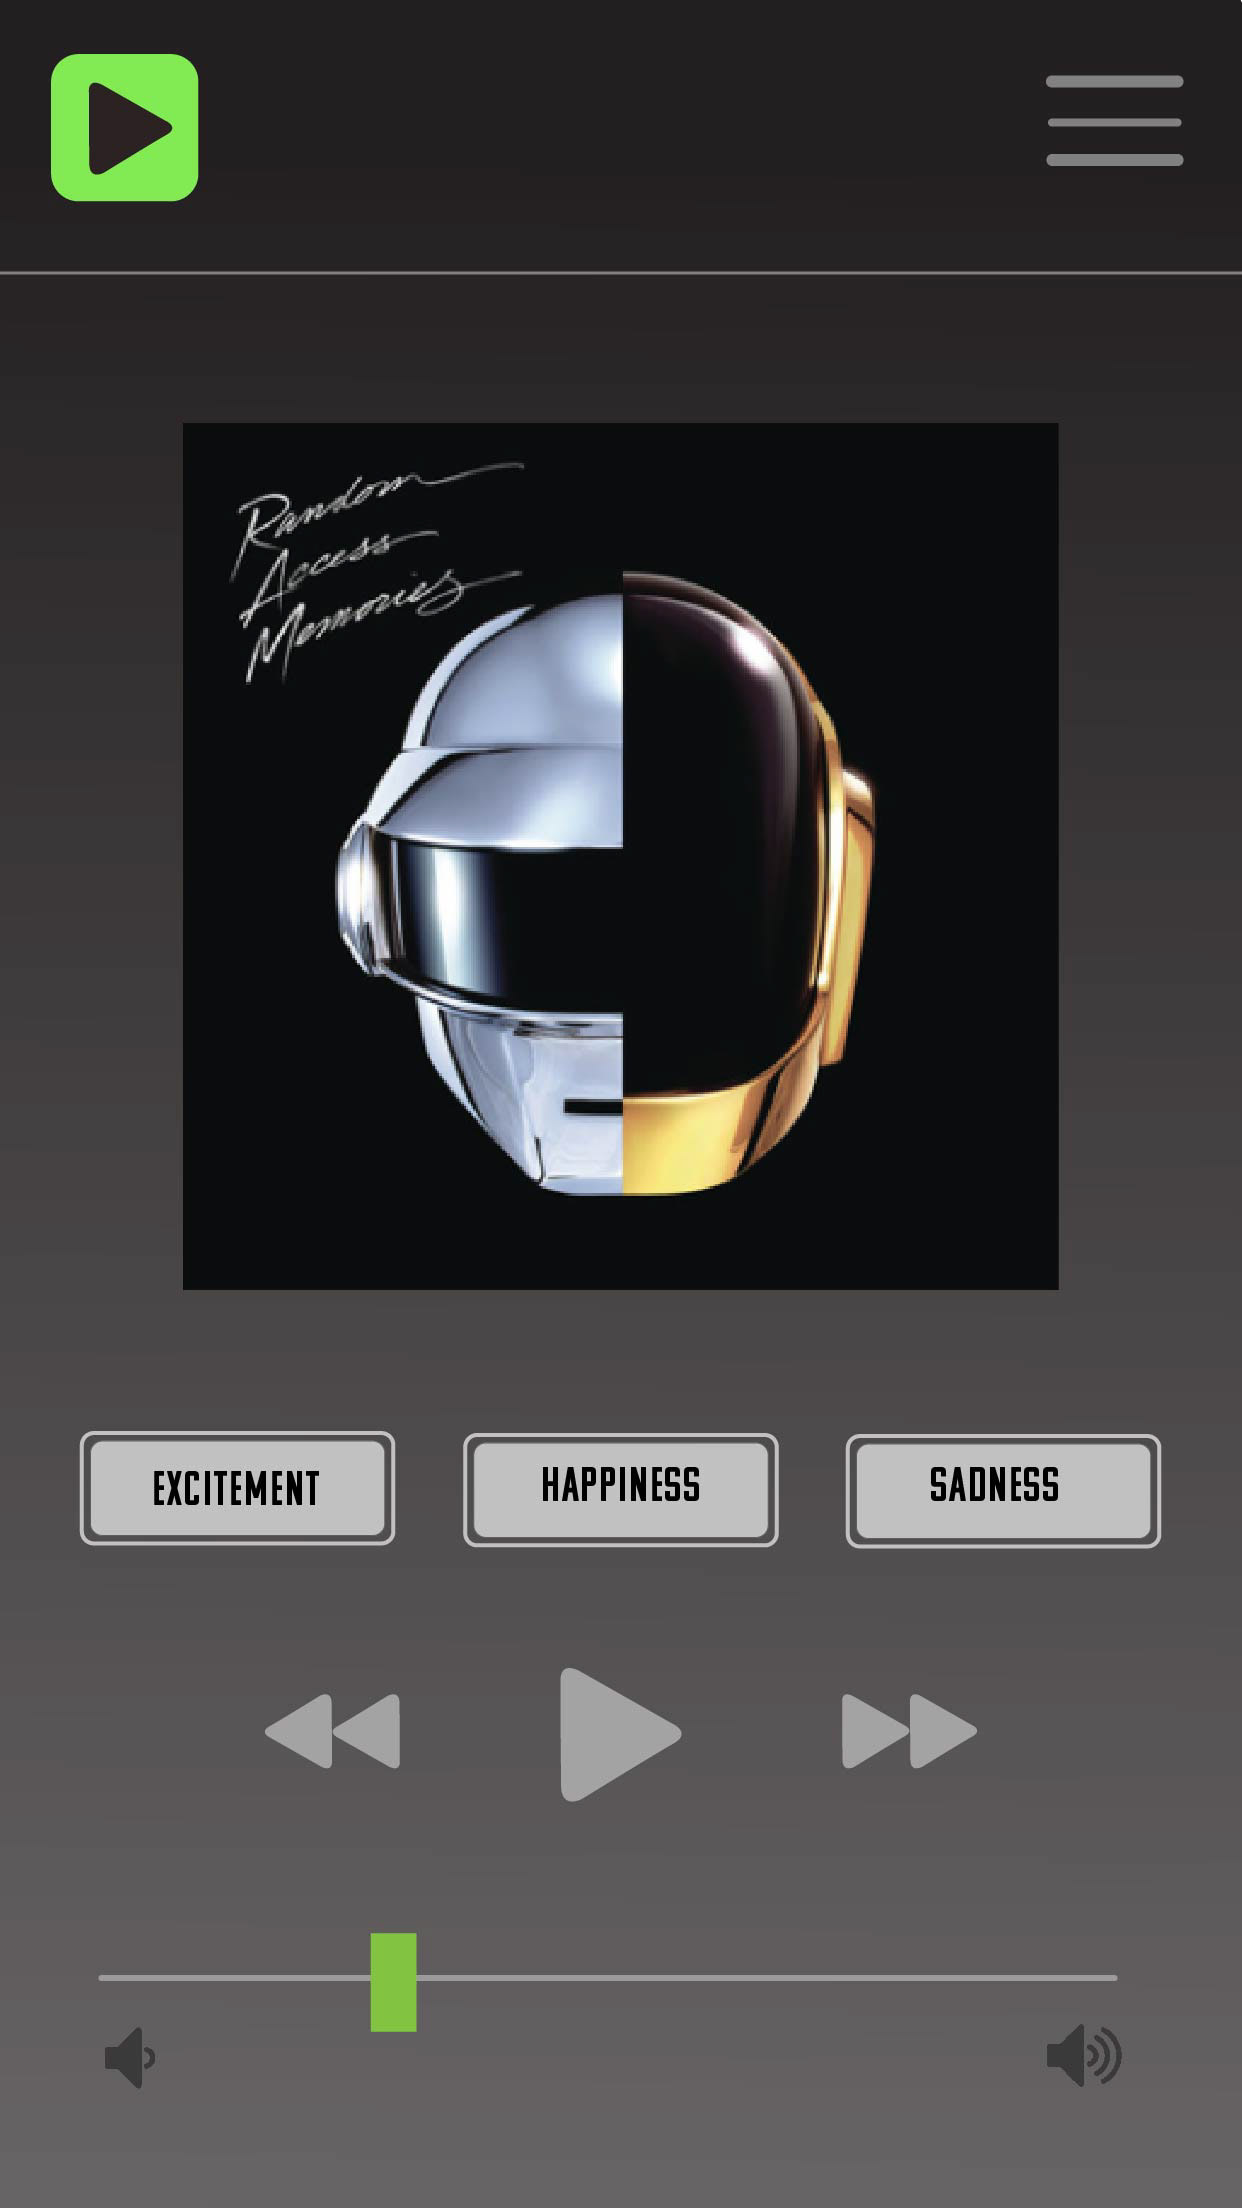
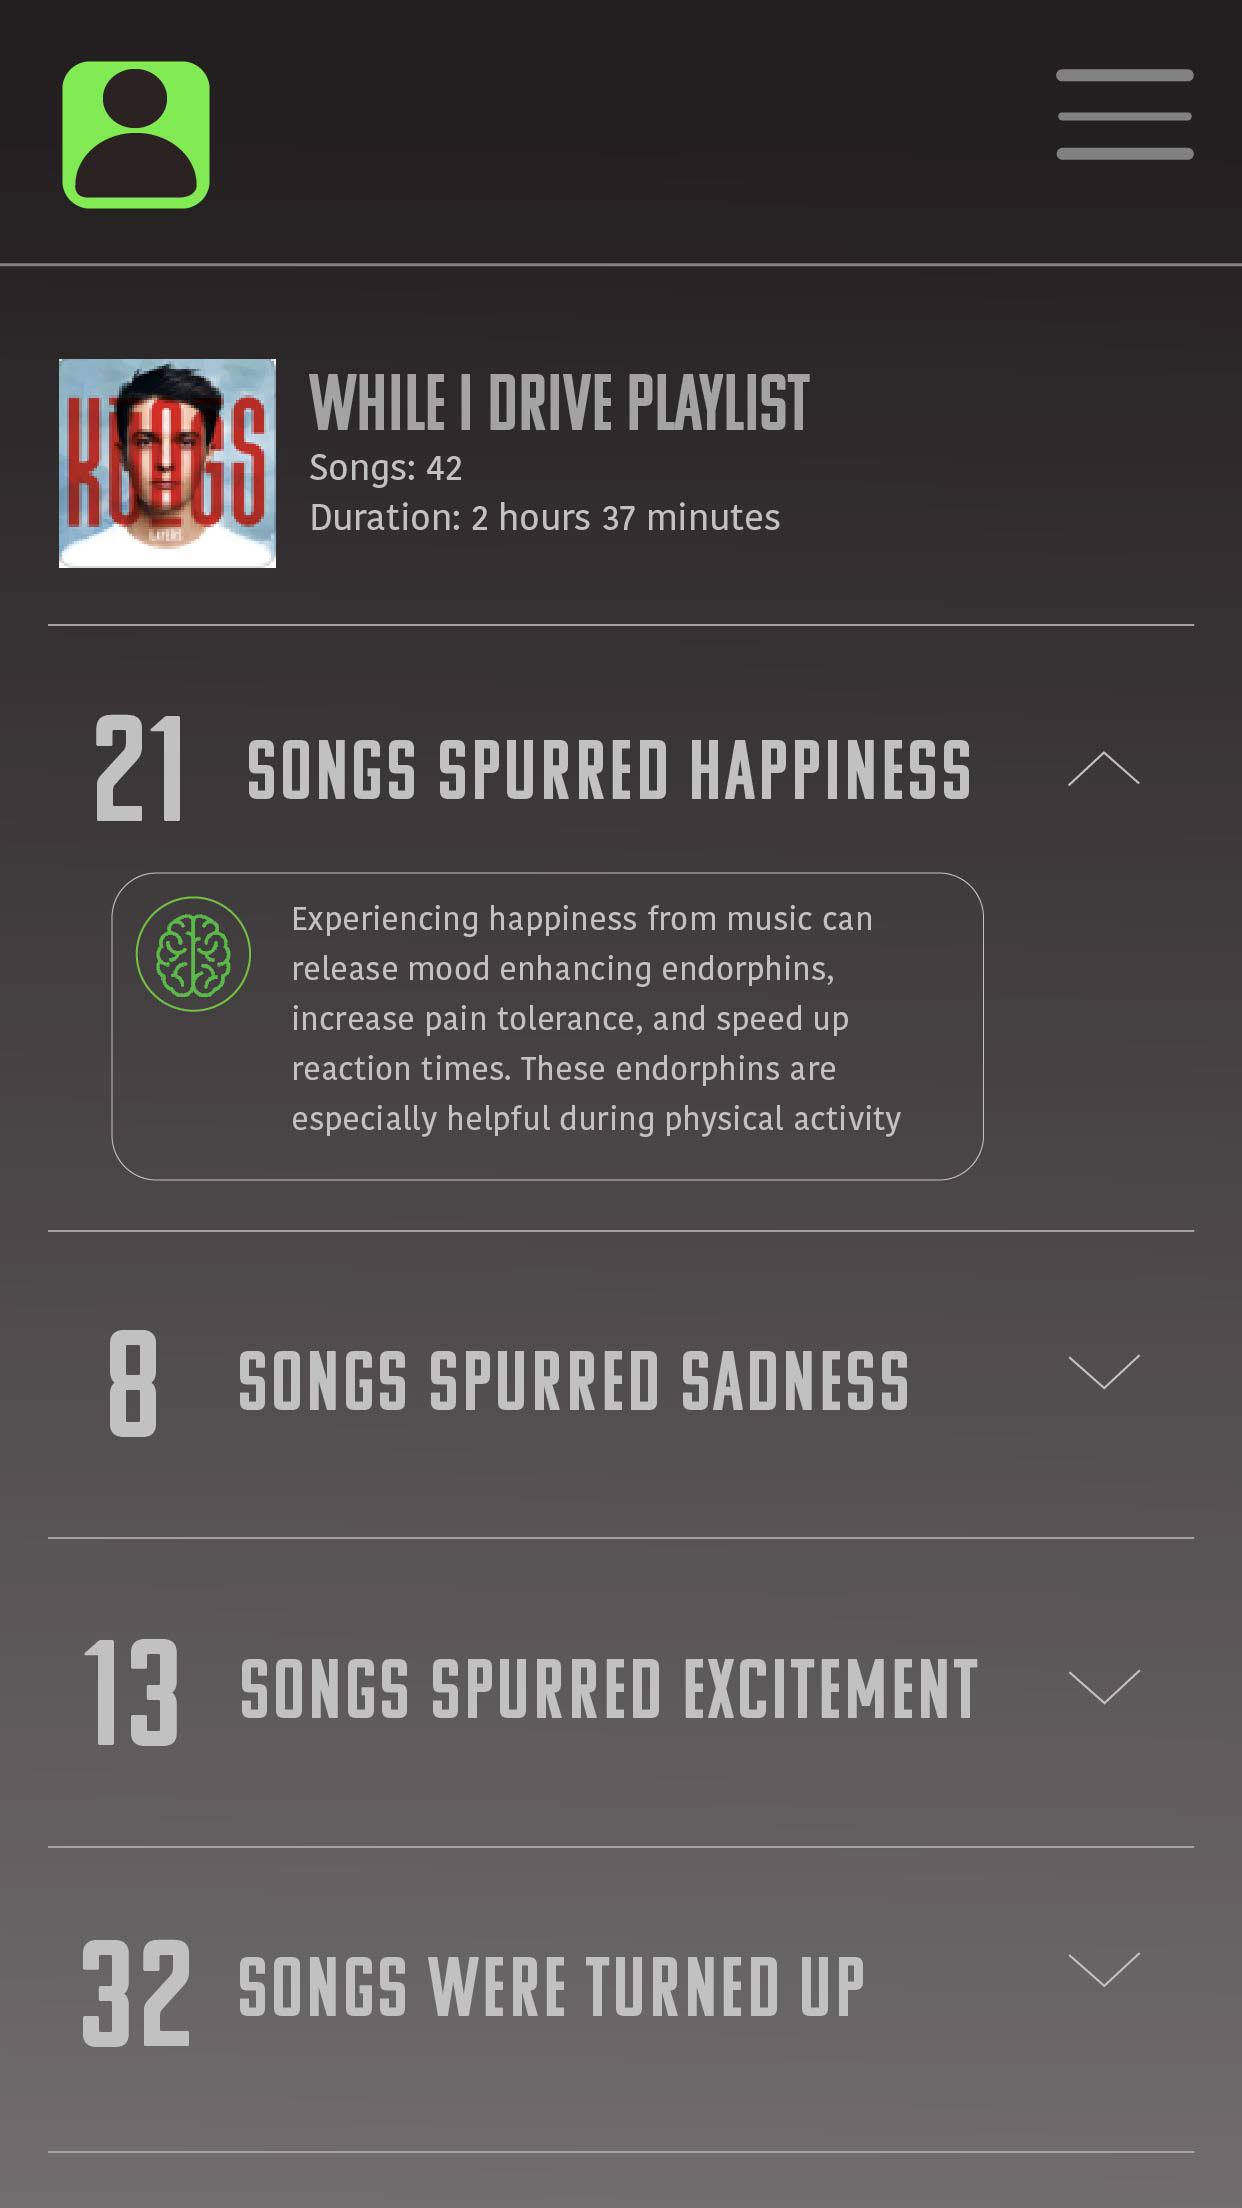
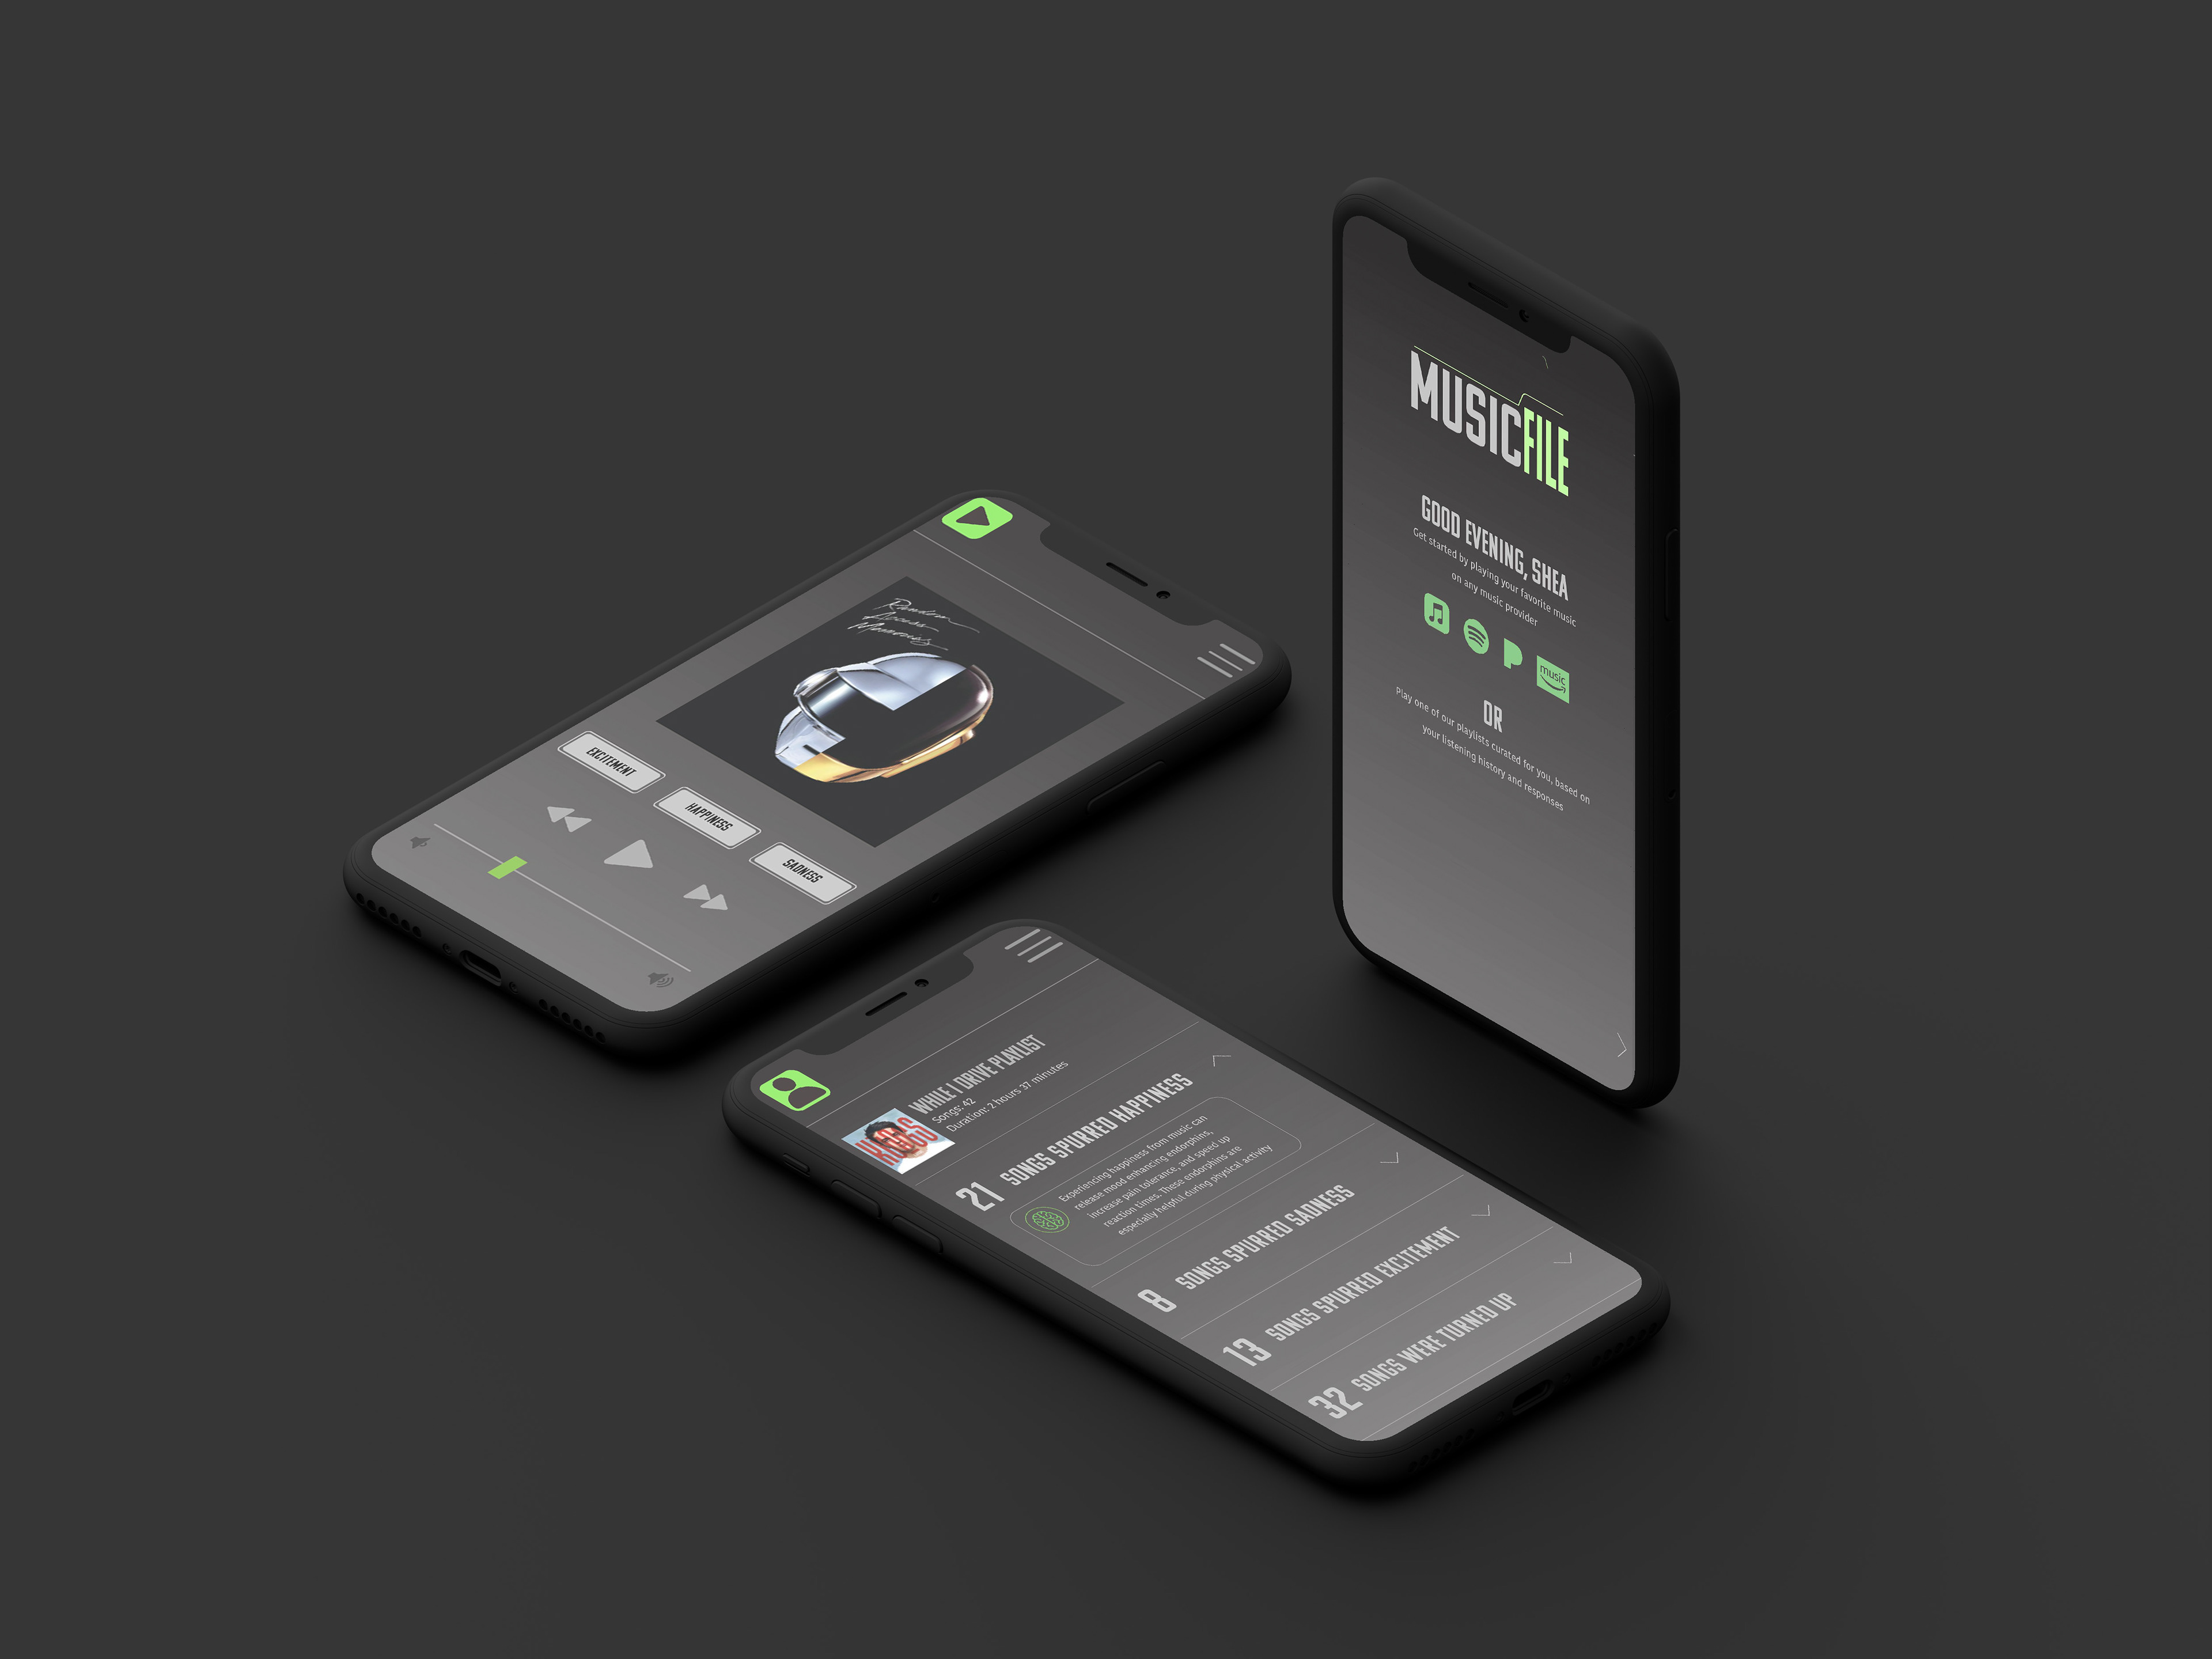
Evolve the flat graphic into a user experience
Prototype the app dashboard
Begin by translating data into public information
Use the data to create a Infographic
Evolve the flat graphic into a user experience
Prototype the app dashboard
Project Outcome:
A multistage translation of data into visual and interactive elements
A multistage translation of data into visual and interactive elements